

Thursday, December 31, 2009

Tuesday, December 29, 2009

Wednesday, December 23, 2009
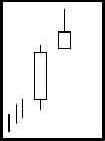
Belajar Candlestick: The Shooting Star
Description
The Shooting Star is comprised of one candle. It is easily identified by the presence of a small body with a shadow at least two times greater than the body. It is found at the top of an uptrend. The Japanese named this pattern because it looks like a shooting star falling from the sky with the tail trailing it.
Criteria
- The upper shadow should be at least two times the length of the body.
- The real body is at the lower end of the trading range. The color of the body is not important although a black body should have slightly more bearish implications.
- There should be no lower shadow or a very small lower shadow.
- The following day needs to confirm the Shooting Star signal with a black candle or better yet, a gap down with a lower close.
Signal Enhancements
- The longer the upper shadow, the higher the potential of a reversal occurring.
- A gap up from the previous day's close sets up for a stronger reversal move provided.
- The day after the Shooting Star signal opens lower.
- Large volume on the Shooting Star day increases the chances that a blow-off day has occurred although it is not a necessity.
After a strong up-trend has been in effect, the atmosphere is bullish. The price opens and trades higher. The bulls are in control. But before the end of the day, the bears step in and take the price back down to the lower end of the trading range, creating a small body for the day. This could indicate that the bulls still have control if analyzing a Western bar chart. However, the long upper shadow represents that sellers had started stepping in at these levels. Even though the bulls may have been able to keep the price positive by the end of the day, the evidence of the selling was apparent. A lower open or a black candle the next day reinforces the fact that selling is going on.
source: candlestickforum
Analisa Saham | Saham Indonesia | Analisa Saham Indonesia | Belajar Analisa Saham
Belajar Analisa Saham Indonesia | Sharing knowledge to bring forward the Indonesia Stock Market
Wednesday, December 16, 2009
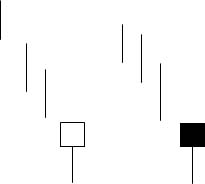
Belajar Candlestick: Hammers and Hanging Man
Description
The Hammer is comprised of one candle. It is easily identified by the presence of a small body with a shadow at least two times greater than the body. Found at the bottom of a downtrend, this shows evidence that the bulls started to step in. The color of the small body is not important but a white candle has slightly more bullish implications than the black body. A positive day is required the following day to confirm this signal.
Criteria
- The lower shadow should be at least two times the length of the body.
- The real body is at the upper end of the trading range. The color of the body is not important although a white body should have slightly more bullish implications.
- There should be no upper shadow or a very small upper shadow.
- The following day needs to confirm the Hammer signal with a strong bullish
day.
Signal Enhancements
- The longer the lower shadow, the higher the potential of a reversal occurring.
- A gap down from the previous day's close sets up for a stronger reversal move provided the day after the Hammer signal opens higher.
- Large volume on the Hammer day increases the chances that a blow off day has occurred.
Pattern Psychology
After a downtrend has been in effect, the atmosphere is very bearish. The price opens and starts to trade lower. The bears are still in control. The bulls then step in. They start bringing the price back up towards the top of the trading range. This creates a small body with a large lower shadow. This represents that the bears could not maintain control. The long lower shadow now has the bears questioning whether the decline is still intact. A higher open the next day would confirm that the bulls had taken control.
source: candlestickforum
Analisa Saham Indonesia: Signal Sell dari SGRO

Saham SGRO
Analisa Saham | Saham Indonesia | Analisa Saham Indonesia | Belajar Analisa Saham
Belajar Analisa Saham Indonesia | Sharing knowledge to bring forward the Indonesia Stock Market
Monday, December 14, 2009
Analisa Saham Indonesia: Signal Buy dari DOID

Saham DOID
Analisa Saham | Saham Indonesia | Analisa Saham Indonesia | Belajar Analisa Saham
Belajar Analisa Saham Indonesia | Sharing knowledge to bring forward the Indonesia Stock Market
Friday, December 11, 2009
Ayo....naiklah POLY!!!

Saham POLY
Analisa Saham | Saham Indonesia | Analisa Saham Indonesia | Belajar Analisa Saham
Belajar Analisa Saham Indonesia | Sharing knowledge to bring forward the Indonesia Stock Market
Tuesday, December 08, 2009

Thursday, December 03, 2009
Beli BBRI lagi yuk....

Saham BBRI
Analisa Saham | Saham Indonesia | Analisa Saham Indonesia | Belajar Analisa Saham
Belajar Analisa Saham Indonesia | Sharing knowledge to bring forward the Indonesia Stock Market
Subscribe to:
Posts (Atom)

